Development of a high-throughput data analysis method for quantitative real-time PCR (qPCR)
by Gregory C. Patton, Ph.D., Andrew N. Gray, Ph.D., Nathan A. Tanner, Ph.D., Janine G. Borgaro, Ph.D., Yan Xu, Ph.D., Julie F. Menin, M.S. & Nicole M. Nichols, Ph.D., New England Biolabs, Inc.
Over the last 20 years, quantitative real-time PCR (qPCR) has become an essential technique in molecular biology for detecting and quantifying nucleic acids. Workflow simplicity and advances in instrumentation now permit sizeable quantities of data to be generated rapidly, with 96, 384, or even 1536 reactions in one qPCR experiment.
The Challenge: qPCR experiments require thoughtful design and analysis to capture all relevant information, such that accurate and appropriate conclusions can be drawn.
Development of NEB’s Luna® qPCR product line required repeated data collection on a series of test panels, each containing multiple targets. It became clear during early development that a more scalable approach to data analysis and visu- alization was required to better understand how changes in reagent composition impacted per- formance. In order to compare various amplicon panels over multiple qPCR runs, instruments, reagents and conditions, a high-throughput data analysis method termed “dots in boxes” was developed. The output of this analysis captures key assay characteristics, highlighted in MIQE guidelines, as a single data point for each qPCR target. This method of analysis permits multiple targets and conditions to be compared in one graph, allowing concise visualization and rapid evaluation of overall experimental success.
What is qPCR
qPCR is a powerful fluorescence-based tech-nique that detects and quantifies nucleic acids in a variety of samples.
qPCR History
In 1992, Higuchi et al. showcased the first example of real-time PCR by using a camera during the amplification reaction to continuously monitor the incorporation of ethidium bromide, an intercalating dye that flu-oresces in the presence of double-stranded DNA under ultraviolet light (1).
Running qPCR Experiments
Currently, most qPCR experiments commonly employ the dsDNA intercalating dye SYBR® Green I or hydrolysis probes (e.g., TaqMan®) to monitor amplification (2). Plotting the measured fluorescence signal versus PCR cycle number results in a graphi-cal representation of amplification. The point at which the fluorescence signal exceeds the background fluorescence level is known as the quantification cycle (Cq). Comparing Cq values permits evaluation of relative target abundance between two or more samples. Alternatively, Cq values can be used to calculate absolute target quantities via reference to an appropriate stan-dard curve, derived from a series of known DNA or RNA dilutions. This technique can be more powerful than traditional PCR, allowing both qualitative information (presence or absence of a target sequence), as well as the quantitative data (nucleic acid quantity) to be determined without opening the reaction tube. Greater sensitivity and lower risk of carryover contamination has resulted in qPCR replacing end-point PCR in many applications.
New qPCR Applications
Today, the technique is used in a variety of fields, from molecular diagnos-tics to agricultural research, and in applications including mutation detection, genotyping, copy number variation and gene expression analysis.
MIQE Guidelines
Rapid adoption of qPCR and its relatively straightforward execution (mixing amplification reagents, primers and template) has led to the generation of an enormous amount of data, as evidenced by the numerous publications con-taining qPCR experiments. However, the ease of generating qPCR data has also proven to be the technique’s greatest challenge (3). A diverse set of protocols, instruments, reagents and analysis methods can be found in the scientific literature, with many publications reporting invalid or conflicting data. The lack of consensus on best experimental practices for qPCR resulted in the establishment of the Minimum Information for Publication of Quantitative Real-Time PCR Ex-periments (MIQE) guidelines by Bustin et al. (4).
The MIQE guidelines established a set of qPCR performance metrics that should be determined and reported in peer-reviewed publications to ensure robust assay performance and reproduc-ibility. These assay characteristics include:
-
PCR efficiency
- One of the most important assay characteristics is PCR efficiency, which is a measure of product duplication at every amplification cycle. PCR efficiency is measured by amplifying multiple known concentrations of nucleic acid to obtain Cq values for each concentration. A standard curve is created by plotting the observed Cq values on the y-axis and the log10 of the template concentration on the x-axis. Efficiency is calcu-lated using the equation: PCR efficiency = 10-1/slope – 1. A slope of -3.32 represents 100% PCR efficiency and indicates doubling of the target amplicon at each PCR cycle.
-
Dynamic range
- The dynamic range establishes the upper and lower limits for quantification and should be lin-ear for at least three log10 concentrations of tem-plate. Preferably, the dynamic range encompasses five to six orders of magnitude. Linearity over a dynamic range is reported by the R2 coefficient of determination for the Cq values linear fit to the standard curve.
-
Limit of detection (LOD)
- The limit of detection is often defined as the lowest concentration at which 95% of target sequences are detected in positive samples. An ideal Poisson distribution and single copy detec-tion dictate the lowest theoretical LOD is 3 molecules per PCR. Its determination establishes the lower boundary for target detection with 95% confidence (5).
-
Target specificity
- Target specificity should be confirmed by prod-uct size, sequencing or melt curve analysis, since primers may unexpectedly amplify off-target regions. In addition, some primer sets have a propensity to form primer dimers during ampli-fication, resulting in inaccurate quantification or false positive results. In order to identify spurious amplification products, no-template controls (NTC) should be included in every qPCR run. As NTCs can identify both unintended amplifi-cation products as well as contamination, criteria should be established for using these controls to determine when data should be accepted or rejected.
-
Assay Precision
- The last factor that should be evaluated is assay precision. Multiple replicates of the same sample should typically have high concordance. Variation inherently increases as the copy number decreases, but also can be attributed to factors such as pipet- ting errors and instrumentation.
Dots in Boxes Analysis of qPCR Data
The MIQE-highlighted metrics described above served as a guide for evaluating reagent perfor- mance during development of NEB's new Luna qPCR and RT-qPCR product line. To ensure strong performance across a range of amplicons, multiple test panels were created, with each panel containing a minimum of five targets that could be run in 96 or 384-well formats. Panels com- prised of gDNA and cDNA targets were used to evaluate DNA-based qPCR master mixes, whereas RNA targets of varying abundance were used to assess RT-qPCR reagents. In general, targets spanned typical qPCR amplicon lengths (~70 to 200 bp), as well as GC content (~40 to 60%). Given the large data set that was created during development, data mining to decipher what changes impacted performance became challeng- ing, and it was clear that a better, more scalable approach to data visualization was needed.
Table 1: Criteria for developing quality score metrics for dots in boxes analysis| Intercalating Dye Chemistry | Hydrolysis Probe Chemistry | |
|---|---|---|
| Linearity | R2 ≥ 0.98 |
R2 ≥ 0.98 |
| Reproducibility | Replicate curves shall not vary by more than 1 Cq. * | Replicate curves shall not vary by more than 1 Cq.* |
| RFU Consistency | Maximum plateau fluorescence signal for all curves shall be within 20% of the mean. Fluorescence signal shall not be jagged. |
Increase of fluorescence signal shall be consistent for all curves, exhibiting parallel slopes. Fluorescence signal shall not be jagged. |
| Curve Steepness | Curves shall rise from baseline to plateau within 10 Cq values or less. |
Curves shall rise from baseline to 50% maximum RFU within 10 Cq values or less. |
| Curve Shape | Curves shall exhibit a sigmoidal shape, resulting in a plateau of fluorescence signal. | Curves need not be sigmoidal, but shall appear to be reaching a horizontal asymptote by the last PCR cycle. |
* At extremely low input (e.g., single copy), the lack of amplification due to the Poisson distribution is taken into consideration.
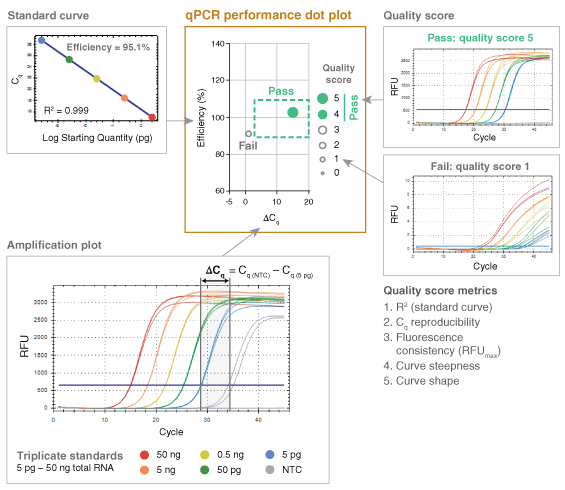
The fundamental performance criteria outlined in the MIQE publication therefore served as a basis for the development of a high-throughput data analysis method termed “dots in boxes” (Figure 1). For each amplicon, PCR efficiency, dynamic range, target specificity and precision was captured as a single data point plotted in two dimensions, with the PCR efficiency plotted on the y-axis and the delta Cq (ΔCq) as the x-ax- is. ΔCq is the difference between the Cq values of the NTC and the lowest template dilution. Setting guidelines around the typical accepted values for these two plotted parameters (PCR efficiency of 90 to 110% and ΔCq of 3 or great- er) created a graphical box, highlighting where successful qPCR experiments (dots) should fall.

While this simple dot plot was informative on its own, it wasn’t sufficient to capture all of the relevant details of each qPCR experiment. In order to represent additional information, such as the linearity of the dynamic range (R2), the overall quality of the qPCR data was scored on a scale of 1 to 5, with 5 representing the highest quality. This scoring method was built upon previous work by Hall et al. (6). Additional performance criteria captured using the 5-point quality score included precision (reproducibility), fluorescence signal consistency, curve steepness and sigmoidal curve shape. Parameters for these five criteria were established to identify when the quality score should be penalized. Scor-ing criteria differed slightly for probe-based chemistry compared to intercalating dye-based detection (Table 1) due to differences in typical curve shape.
Once assigned, the quality score for each amplicon was represented by the dot size and opacity. The higher the quality score, the larger the dot. Additionally, quality scores of 4 and 5 were represented as solid dots while a score of 3 or less was captured as an open circle for simple visual screening of performance. Amplicons falling in the box and receiving a quality score of 4 or 5 represented high quality, reliable qPCR data. The dots in boxes method allowed multiple targets and conditions to be plotted on a single graph and compared quickly, creating an efficient, high-throughput visual method for data analysis.
To rigorously test qPCR performance, experi-ments were designed to simultaneously evaluate efficiency over a broad dynamic range of input concentrations; sensitivity by assessing low-input detection; and specificity by assessing off-target amplification. To accomplish this, qPCR effi-ciency was measured over a five-log dilution of template with data collected in triplicate for each dilution and a NTC. For genomic targets, an average of ~2 copies per reaction was routinely tested to assess the limits of low input detection. Since the ΔCq incorporates both the Cq of the lowest input and that of the NTC (ΔCq = Cq(NTC) – Cq(lowest input)), it allows sensitivity and specificity to be captured in a single variable. Inability to amplify the lowest template dilution results in a ΔCq of 0 in most cases, since curves failing to cross the threshold are automatically given a Cq value corresponding to the total number of am-plification cycles. The presence of non-specific or contaminating amplification in NTC reactions also reduces the ΔCq, such that either lack of low-input amplification or excessive off-target amplification can push the ΔCq below the passing (≥ 3) threshold. Target specificity was also evaluated using denaturation or melt curves for all intercalating dye-based qPCR assays, although this information was not captured in the dot plot.
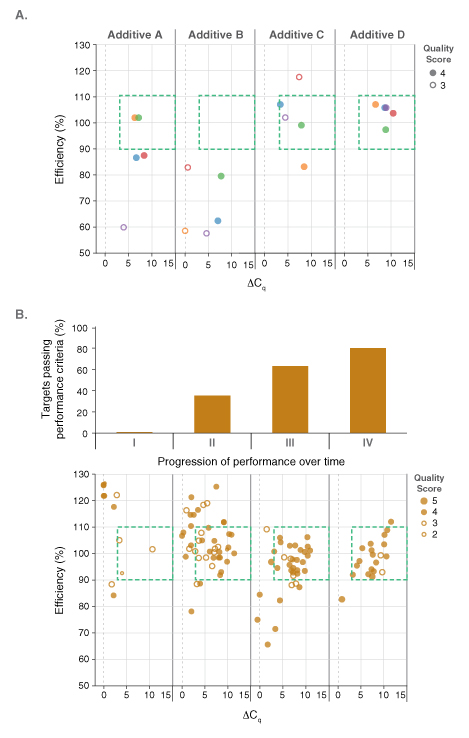
Pairing dots in boxes with an existing custom laboratory information management system (LIMS) permitted the performance of reagents to be screened and tracked on all amplicon panels. The LIMS, previously established for the development of NEB’s Q5® High-Fidelity DNA Polymerase products, was modified to capture all relevant experimental details. The database connected results from each qPCR experiment (e.g., Cq values, PCR efficiency, and linearity) to the contents of each well in that experiment (e.g., target, template concentration, primer concentration, qPCR master mix, additives, etc.) such that performance could be linked to reaction variables and conditions. Additional details including the operator, real-time PCR instrument ID, and cycling conditions were also recorded. Tableau®, an analytics software package, was used to analyze the data and to create graphical displays of the dot plots. An example outcome is shown in Figure 2A. Here, the impact of known PCR additives and the concentration ranges that were beneficial to performance were quickly assessed on a development lot of the DNA dye-based master mix. Additive D resulted in the best performance on this particular panel of five amplicons. Unfortunately, improved performance on one particular qPCR panel did not necessary translate to positive performance across all panels evaluated. Thus, the development process was by necessity methodical and iterative. This made the ability to analyze and visualize large sets of results, covering multiple test panels, formula-tions and experimental conditions, all the more crucial. Dots in boxes thus played a critical role in the development of NEB’s Luna products, driving reagent optimization by quickly identi-fying compositions with increased performance across all test panels. Successful compositions were built upon and fine-tuned, progressively improving the percentage of amplicons that fell in the box with high quality scores (Figure 2B), and thus overall performance. As a result, the final Luna qPCR formulations exhibit robust performance on diverse targets from a wide range sample types and sources.

Dots in Boxes as a Comparison Tool
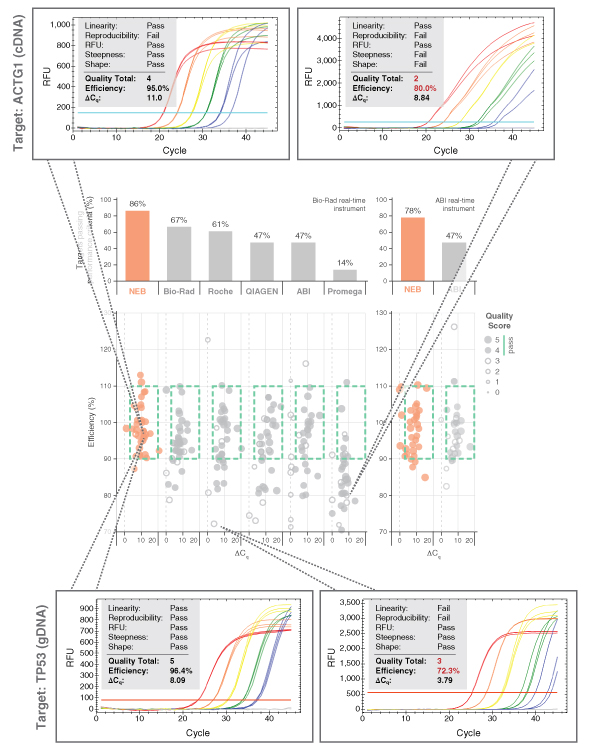
Dots in boxes also permitted large-scale perfor- mance comparisons between the Luna Universal qPCR and RT-qPCR reagents to various other commercial product offerings. Each commercial mix was challenged against test panels containing a range of targets. Amplicon panels used during the development were tested with a commercial primer/probe sets and a variety of commercial mixes. Data was collected by two separate users and experiments were performed according to each manufacturer’s specific product recom- mendations. The results for the Luna Universal qPCR Master Mix (NEB #M3003) are shown in Figure 3. Luna generates the highest quality qPCR data of all reagents tested, with 86% of all amplicons tested falling in the box with high quality scores. Strong performance was selected for each Luna product; dots in boxes performance comparisons for each Luna product can be found at LUNAqPCR.com.

Conclusion
Dots in boxes is a powerful, high-throughput data analysis method based on the MIQE guide- lines. It enables rapid, concise comparison of qPCR performance across many targets and for multiple reagents, conditions and/or protocols, permitting an overview of qPCR performance over thousands of reactions where such visualiza- tion was not previously possible. Combining the dots in boxes analysis method, a range of target test panels, and a custom LIMS enabled us to create and mine large data sets for information, identify critical variables that affect amplification in qPCR, and harness this information to opti- mize qPCR reagents. The dots in boxes analysis tool was thus invaluable in development of the Luna qPCR and RT-qPCR reagents, and will continue to benefit future qPCR evaluation and development efforts.
References
- Higuchi, R., et al. (1992) Biotechnology. 10, 413-417.
- Navarro, E., et al. (2015) Clin. Chim. Acta. 439, 231-250.
- Bustin, S.A., and Nolan, T. (2004) J. Biomol Tech. 3, 155-156.
- Bustin, S.A., et al. (2009) Clin. Chem. 55, 611-622.
- Wittwer, C.T., et al. (2004) Washington: ASM Press. 71-84.
- Hall, A.T., et al. (2013) PLOS One 8: e73845.

