
Fundamentals of Trust: A Guide to Evaluating the Quality and Integrity of Scientific Reagents
Posted on Monday, November 16, 2026
By
Topic: Tips for the lab, What is Trending in Science
Your work depends on scientific materials working as intended. When they fail, it fritters away precious resources, and the ripple effects can derail scientific innovation. As a research scientist, Nicole M. Nichols, Ph.D., who now serves as Executive Director of Product Development at New England Biolabs (NEB), experienced this frustration first-hand.
"I was troubleshooting an issue with high background noise on my gels. This issue was unrelated to my actual research question, but I needed to resolve it to read my data." After many weeks of troubleshooting, she identified the problem — her gloves. "The formulation of my gloves had changed, and something in the gloves was interacting with the gel dye. The experience was extremely frustrating. I lost so much time troubleshooting that I needed to spend doing the actual research."
As a scientist, you cannot know exactly how a product will perform before you apply it to your workflow or anticipate every question you will need answered. But, as you are evaluating scientific products and troubleshooting workflows, there are often important signals of quality and integrity that you can evaluate in advance — and steps that expedite troubleshooting when research is underway.
Drawing from experiences as research scientists, product developers, quality assurance specialists and scientific illustrators, team members at NEB explore what can give a scientist confidence when purchasing reagents, and how to gain clarity as questions arise during the research process.
Is essential documentation on product quality and composition easy to find?
“Essential information about the product’s quality and composition should be readily available," says Lance Goodreau, Senior Director of Quality and Regulatory Affairs at NEB. This documentation is critical when comparing products from different suppliers across functionality and pricing. If there are unaccounted differences in product formulations, like different enzyme Unit Definitions — which estimate enzymatic activity, protein concentration levels or specific activity of enzymes between the two suppliers — it can complicate comparisons between workflow outputs.
A product's essential documentation includes the:
- Quality Specifications sheet, which includes shelf life and test attributes including purity specifications,
- Certificate of Analysis,
- Certificate of Origin (including TSE/BSE Statements),
- Safety Data Sheet,
- Intellectual property restrictions,
- Environmental Restrictions (e.g. REACH Regulations) which inform use of the product in different global markets,
- Export Control Declarations,
- Regulatory Support Files (for regulated markets), and
- Lot-to-lot variability data.
If you are having trouble locating or interpreting these documents, or need information that may not be readily available such as troubleshooting data, make a direct request to customer service or technical support. Reagent companies should have several avenues for these dialogues with customers, and they happen routinely. At NEB, Goodreau sees inquires for QC, QA, and data documentation often.
Do you understand the information you have?
Another clear "confidence signal" to look for on a product page is information clarity. Is the information communicated across a webpage clear, concise and consistent, or do you struggle to interpret what is presented?
As a rule, product pages will have claims that are compelling and easy to remember. For instance, "this reagent is highly efficient" or "this reagent is more robust." If a page communicates information transparently, it will provide the information you need to come to that conclusion on your own. It will also provide the information needed to contextualize a memorable claim like "highly efficient" — specifically, faster compared to an equivalent product, using a repeatable method, when applied to a relevant application.
 |
Scientists should be able to derive comparative claims like "highly efficient" or "highly robust" from the data provided on a product page. In the below example, the figure is titled "Robust Amplification with Q5 and Q5 Hot Start High-Fidelity DNA Polymerases." |
|
Original caption: Amplification of a variety of human genomic amplicons from low to high GC content using either Q5 or Q5 Hot Start High-Fidelity DNA Polymerase. Reactions using Q5 Hot Start were set up at room temperature. All reactions were conducted using 30 cycles of amplification and visualized by microfluidic LabChip® analysis. |
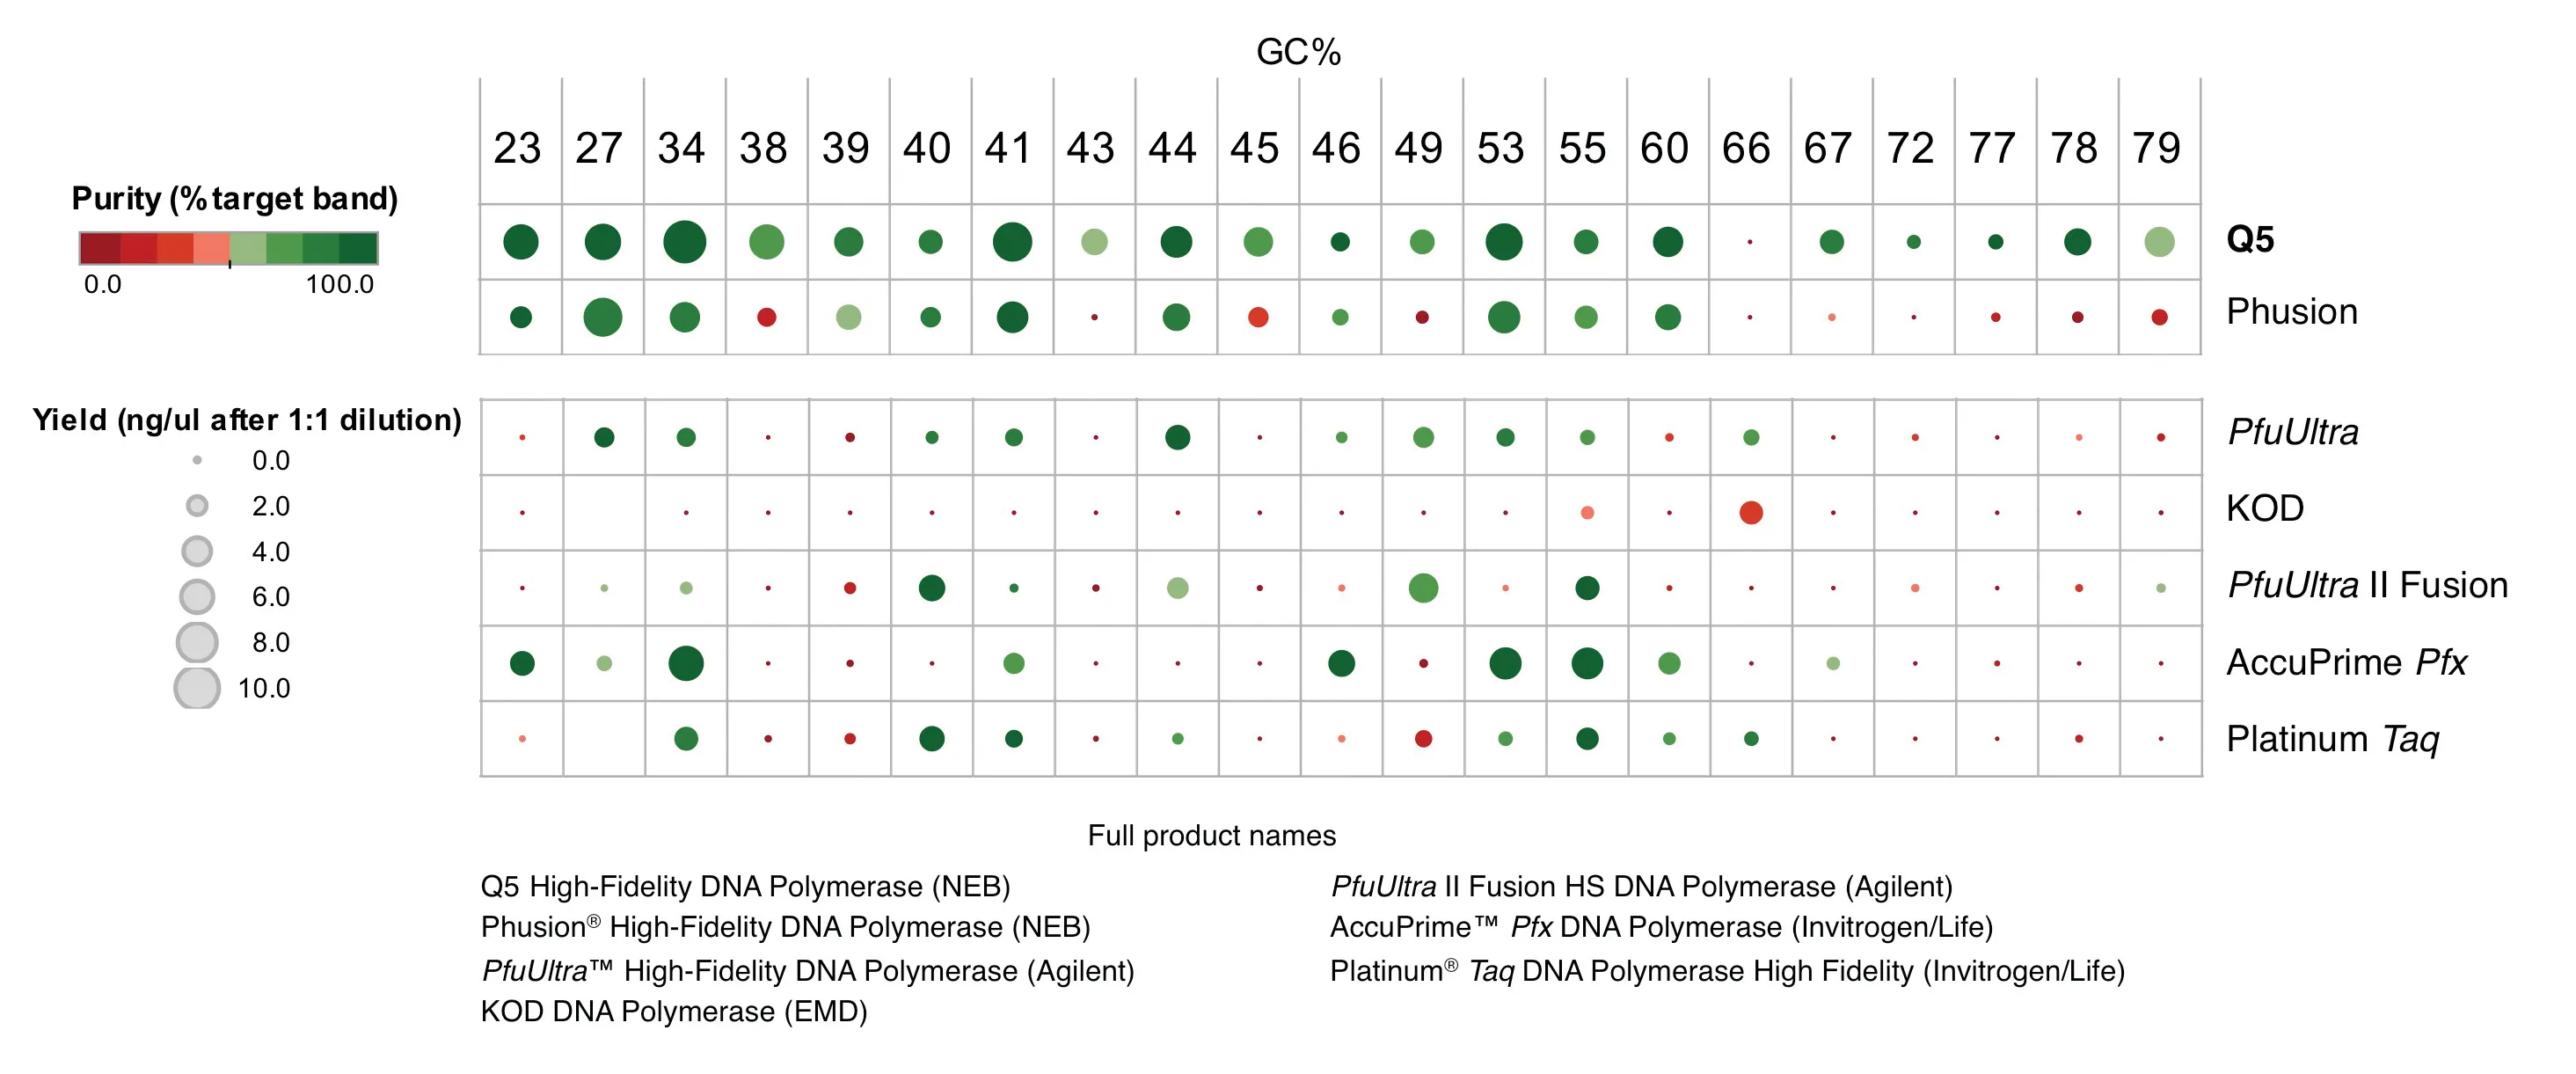
Some elements of information transparency are intuitive to scientists accustomed to data interpretation: clarity of method description, clearly labeled axes and comparators, and statistically significant sample sizes with error bars. Other elements may require more digging. For instance, when an experiment compares the performance of multiple products, is it clear that the product versions are equivalent? If the product and product versions being compared are not identified, or if the Unit Definitions of an enzyme reagent are not comparable, the results may be misleading.
Sometimes, achieving a balance between clarity and data transparency is difficult. This can be common with gel images, western blots or autoradiograms. As a Scientific Illustrator for NEB, Tasha José has much experience navigating this balance. José employs design fundamentals, like color, contrast, layout, and spacing to make data interpretation more intuitive, but the data itself cannot be altered. “If there are speckles on a gel figure, the speckles stay. They are part of the data."
|
The integrity of gel-based data requires an unaltered image of the gel. “Imperfections” within the image are part of the data and must remain untouched. In the below example, the left figure is titled "Protein expression using the PURExpress® In Vitro Protein Synthesis Kit," and the right figure is titled "Incorporation of 35S-methionine enables visualization of protein by autoradiography." |
|
Original captions: (left) 25 μl reactions containing 250 ng template DNA and 20 units RNase Inhibitor were incubated at 37°C for 2 hours. 2.5 μl of each reaction was analyzed by SDS-PAGE using a 10–20% Tris-glycine gel. The red dot indicates the protein of interest. Marker M is the Protein Ladder (NEB #P7703, discontinued and replaced with NEB #P7717).; (right) 25 μl reactions containing 250 ng template DNA, 20 units RNase Inhibitor and 2 μl 35S-met were incubated at 37°C for 2 hours. 2.5 μl of each reaction was analyzed by SDS-PAGE, the gel was fixed for 10 minutes, dried for 2 hours at 80°C and exposed to x-ray film for 5 hours at -80°C. |
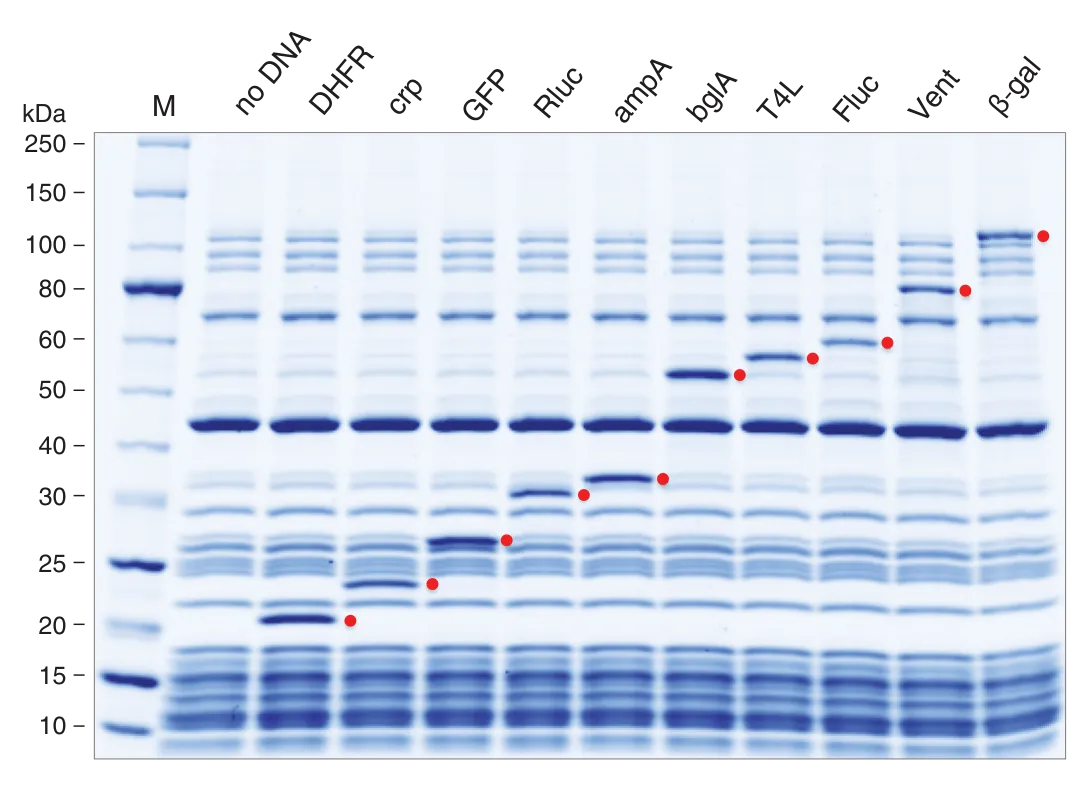

José also collaborates with product developers to identify how to supply context in infographics or captions to support data-based visuals and make them less cluttered. Data integrity and transparency demand that context cannot be withheld — but identifying where information should appear is a communication decision.
Illustrating how a product claim was validated becomes especially challenging when that product has no clear comparators. Comparisons to legacy methods are not enough; the product should have a control that can establish the validity of a novel capability. The development of the NEBNext® Low-bias Small RNA Library Preparation Kit provides an example of how NEB has addressed this challenge.
During kit development, defining low bias was difficult because the “truth" of an RNA profile can vary by cell type and biological state, and relevant standards were not available. To validate a reduction in bias, NEB scientists developed a set of non-naturally occurring spike-in sequences to use throughout the workflow and included matched pairs of sequences with different 5´ ends. This allowed the team to measure whether the process introduced any downstream skew on RNA representation without comparisons with a pre-existing method. The results of this spike-in-control was convincing and justified the release of the product — the product release required explicit communication of the control method, so that customers could replicate it. In fact, due to the lack of existing controls for RNA size bias, the methodology itself became a valuable resource for researchers.
|
Developing the validation data for NEBNext Low-bias Small RNA Library Prep Kit required developing a synthetic control designed to assess bias in sequencing of small RNA. In the below example, the figure is titled "NEBNext Low-bias Small RNA Library Prep Kit produces libraries with the lowest bias." |
|
Original caption: NEBNext Low-bias Small RNA libraries were made using a mix of 100 synthetic control miRNAs, including five that had 3´ 2´-O-methyl ends. Libraries were prepared from 0.3 ng of the synthetic miRNA mix to compare library-generated bias between the NEBNext Low-bias Small RNA Library Prep Kit and small RNA kits from Revvity® (NEXTFLEX® Small RNA Sequencing Kit V4), Qiagen® (QIAseq® miRNA Library Kit) and Illumina (TruSeq® Small RNA Library Prep). Libraries were sequenced on an Illumina NextSeq® 500 (1 x 56 bases), and 5 million reads from each library were adaptor trimmed (Flexbar) and aligned to the synthetic sequences using STAR (v2.7.8a). Expected reads were calculated from total reads mapped to the synthetic controls, divided by the total number of control sequences, represented here by the black line at 100%. Percent of observed reads to expected reads was calculated for each control sequence and plotted across replicates. For the NEBNext libraries, 90% of the control mix miRNAs were located within 2-fold of expected, whereas the competitor kits had between 19–30% fall within that range. Competitors' kits had more underrepresented sequences (50–65%) than overrepresented (15-24%). Libraries produced by the NEBNext Low-bias Small RNA Kit reliably generated libraries with the lowest bias. |

While taking the time to assess the transparency of product information can be time consuming, a healthy suspicion of product claims or over-simplified data can pay dividends downstream. Nichols recalls her warning to scientists when she led NEB’s Amplification team, "I could pick a single amplicon that would show you whatever you want — but a single amplicon would not represent the whole picture.”
Is the information useful to your application?
Another early confidence signal that you can derive from a product page is a clear impression of how a product will serve you, specifically. Speed and efficiency are universal needs across a variety of use cases. But does the page also offer evidence of qualities that are use-case specific — and does it specify any limitations? This level of detail helps distinguish pages that are designed to market a product from those that are designed to provide useful information to a researcher.
NEB is in a unique position to anticipate application-specific context for products early in development because it has an independent research team of scientists who apply products in innovative ways to solve their own research problems. This team both fuels and provides early “voice of customer” feedback on how products in the development pipeline are performing across specific research applications, which helps inform an early understanding of a product’s utility, as well as its quality and data integrity requirements.
In some cases, communicating the evidence that a product benefits a research application can be quite challenging, and requires creative ways of representing information. The NEB team faced this challenge when developing a new representation for qPCR, which resulted in the "dots and boxes" method.
Nichols recalls that during the development of their qPCR reagents, interpreting the resulting qPCR data was difficult because there were key satisfaction drivers beyond the obvious technical metrics. For instance, adding blue dye made liquid visible in 96-well plates, ensuring users could easily see if they had added the reagent.
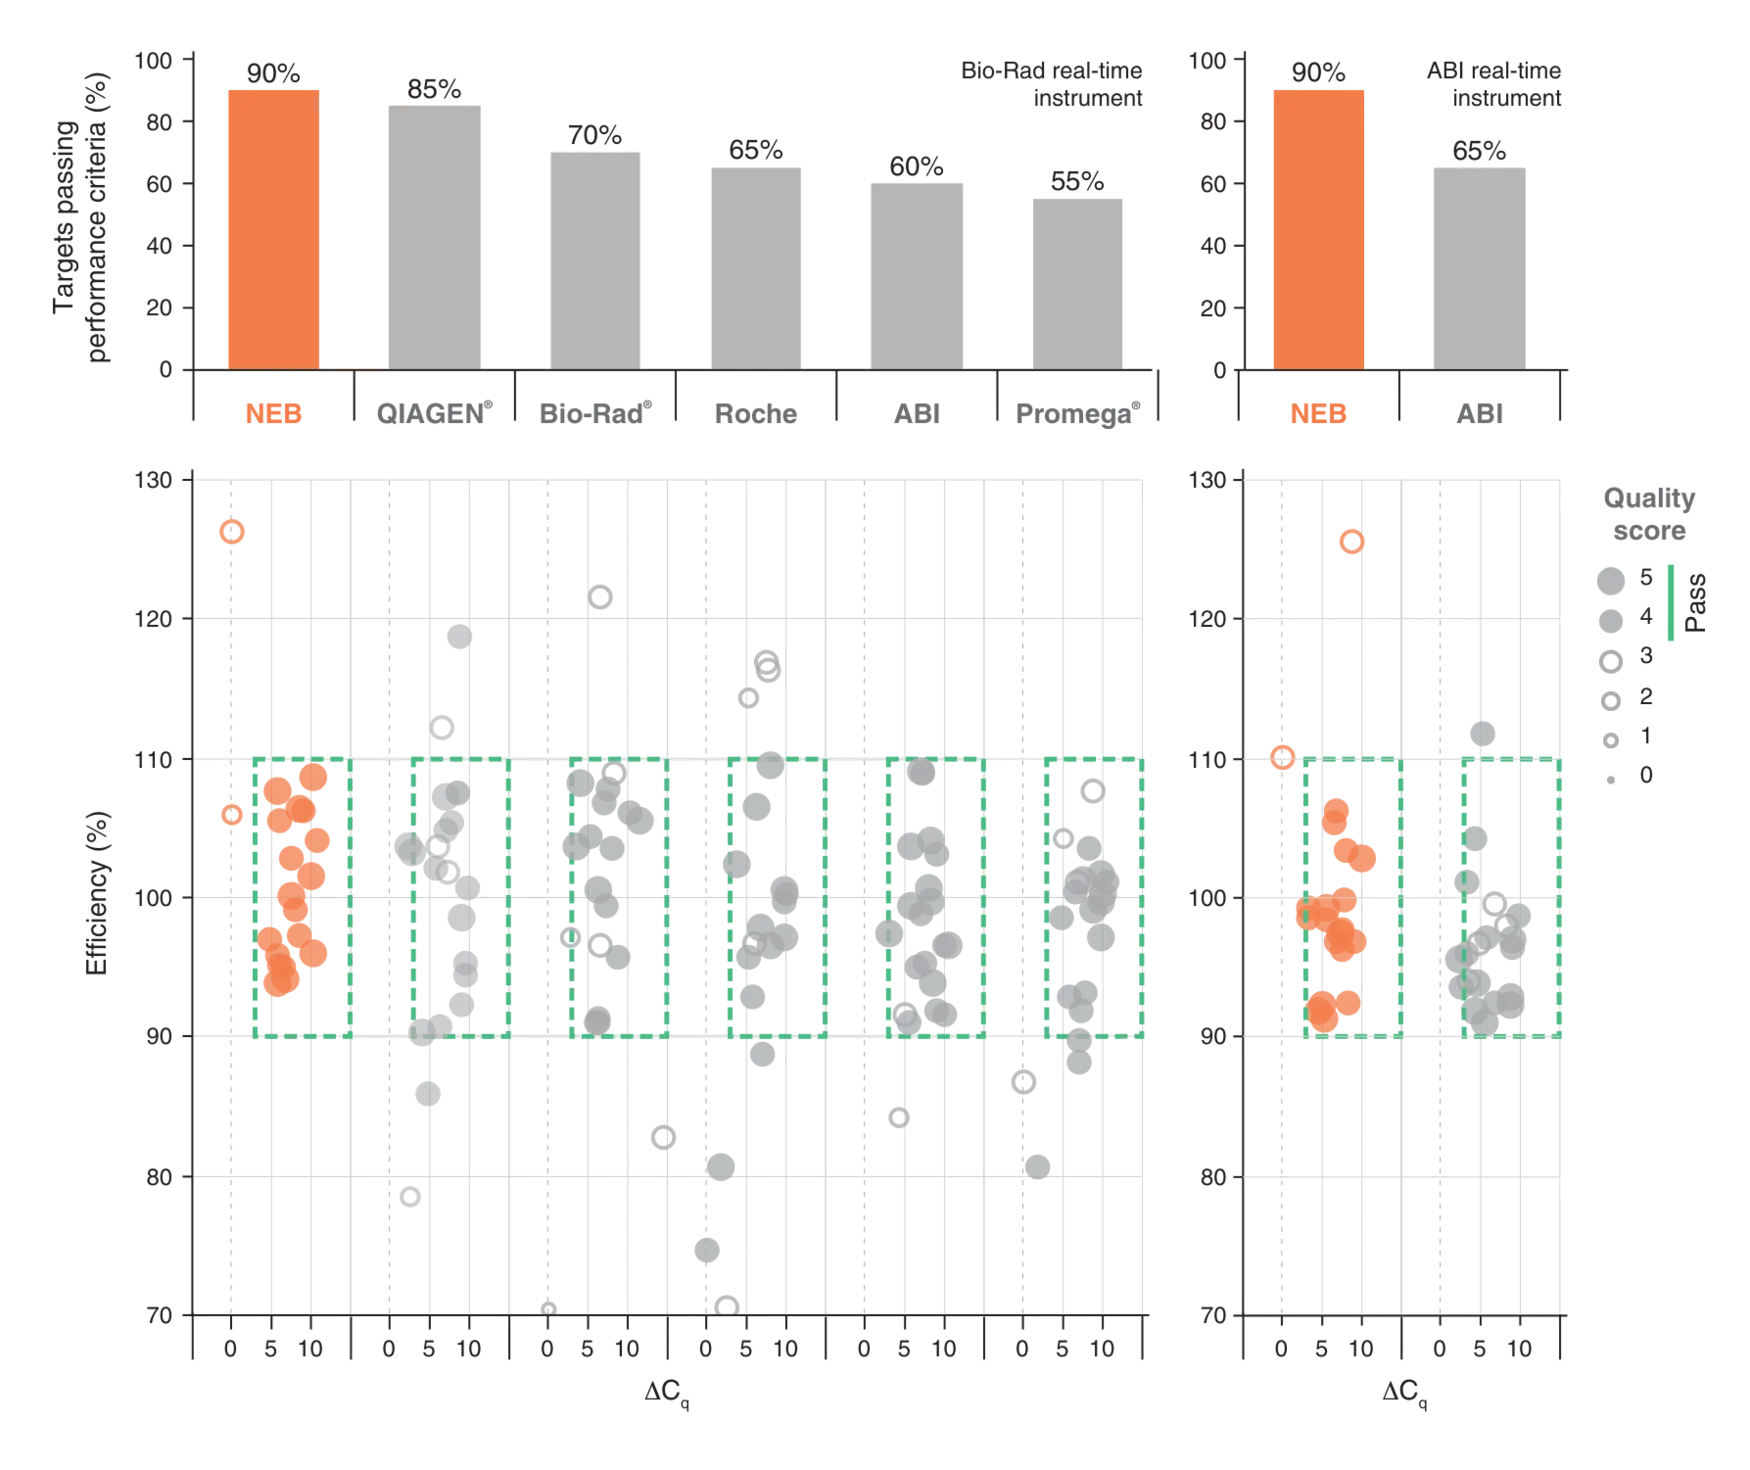
“We looked at the shape of the curves and asked a subjective question: How satisfied would I be if I replaced a competitor product with this one?" To answer this question, the development team created a structured evaluation method for qPCR reagents that combined established, quantitative protocols, like the MIQE guidelines, with qualitative factors, such as overall curve quality. Then, the team iterated and gut-checked the scoring assumptions against subsets of data to ensure the visual representation was accurate and unbiased. Ultimately, this approach allowed them to synthesize many relevant factors impacting the value of qPCR reagents into a single visual a researcher could use to interpret product quality.
|
NEB developed the "dots in boxes" method to visualize a structured, multi-factorial evaluation of qPCR reagents. In the below example, the figure is titled "Extensive performance evaluation of commercially available dye-based qPCR reagents demonstrates the robustness and specificity of Luna." |
|
Original caption: qPCR reagents from NEB and other manufacturers were tested across 16–18 qPCR targets varying in abundance, length and %GC, using either Jurkat genomic DNA or Jurkat-derived cDNA as input (10 genomic DNA targets and 8 cDNA targets on Bio-Rad real-time instrument, 9 genomic and 7 cDNA targets on ABI instrument). For each testing condition, data was collected by 2 users and according to manufacturer’s specifications. Results were evaluated for efficiency, low input detection and lack of non-template amplification (where ΔCq = average Cq of non-template control – average Cq of lowest input). In addition, consistency, reproducibility and overall curve quality were assessed (Quality Score). Bar graph indicates % of targets that met acceptable performance criteria (indicated by green box on dot plot and Quality Score > 3). Results for NEB and other major manufacturers are shown: Bio-Rad, SsoAdvanced™ Universal SYBR® Green Supermix; Roche, FastStart™ SYBR Green Master; QIAGEN, QuantiTect® SYBR Green PCR Kit; ABI, PowerUP™ SYBR Green Master Mix; Promega®, GoTaq® qPCR Master Mix. The Luna Universal qPCR Master Mix outperformed all other reagents tested. |
Do product pages reflect recent scientific advancements?
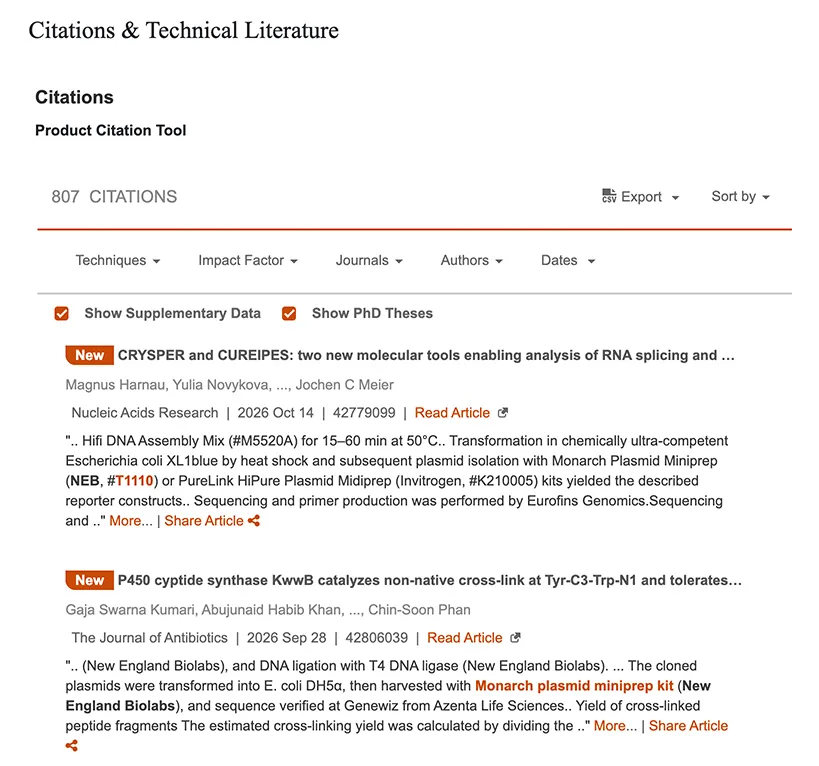
The applications for a life science product and the available alternatives evolve over time. Accordingly, a product page should recognize recent scientific advancements. While no page can detail every possible emerging use-case, researchers can gain assurance that a product’s comparative quality is being evaluated over time if a product page indicates compatibility with emerging scientific applications — or even suggests alternative products that may be a better fit. Evidence of application may be found within peer reviewed literature that utilized the product, or application notes.
|
NEB provides a list of citations and technical literature that utilized a product within the product page, to help researchers align products with their intended application. |
 |
Researchers should also look for evidence that a company will act on reports of product failures and technical challenges. Are there troubleshooting resources available? Is there an easy way to connect with technical support staff? Ultimately, customer reports of product challenges are an essential part of a feedback loop that keeps legacy products contextually relevant and inspires new solutions.
“It sounds counterintuitive, but it's exciting — and helpful — when our legacy products fail. It means science is advancing, and that product innovations are needed to help scientists break new ground,” reflects Nichols. “The documentation we provide represents an immense amount of work and testing to map out the capabilities and limits of our products, but we cannot anticipate every future application at launch. Pushing past those limits is the nature of novel research, and we want customers to share their results with us. Knowing whether a product worked or failed in a new application helps us guide the scientific community and prevents other researchers from repeating unsuccessful experiments.”
To illustrate her point, Nichols shared a specific example. “Early versions of our enzymatic fragmentation mixes erased methyl marks at the ends of DNA fragments, so we warned researchers not to use them for methylation studies. We eventually developed newer versions that preserved these marks — specifically because we saw researchers attempting this application.”
Can you rely on the technical support team when challenges arise?
As a scientist, you can rely on a few absolutes — save that at some point, your experiment will fail. While problem-solving is intrinsic to the scientific process, reaching out for technical support from a reagent supplier requires both vulnerability and trust. The customer must be able to trust that the support staff knows the product best. And, the customer must trust the technical support scientists to guide them through the first principles of troubleshooting: start from the basics, check every assumption, and isolate variables systematically.
Before investing in a scientific reagent, a researcher should ask themselves if they can trust the technical support team should a challenge or question arise. NEB has developed a unique technical support system to make that question easy to answer. Customers are connected to scientists on staff who are experts in the product or its application. Designated technical support scientists often come to the conversation with direct experience manufacturing, developing or using the product in their daily research. Deep familiarity with the product and the research process ensures NEB scientists can help customers identify underlying issues and connect them with the exact resources they need.
Sometimes, troubleshooting calls turn into collaborations. For instance, if the NEB technical support team receives reports of the same issue repeatedly, or if a user’s results are especially surprising, the team may replicate the experiment internally, to check if something is missing or misunderstood. The team may also send free samples to help explore how a product performs in a novel application.
NEB’s technical support page offers multiple ways to get in touch and short videos explaining the technical support model.
Quality is a process and a culture
“Ultimately,” reflects Nichols, “our goal is to build long-term partnerships rather than to act only as a vendor. That comes down to trust, which is established through every operational touchpoint. Did the product arrive on time? Is there a knowledgeable person to talk to when something goes wrong? These experiences reinforce the integrity of our products to our customers.”
Lauren Brown, Director of Quality Control at NEB, reflects that this trust depends on a culture of quality. "You can't solely add quality into a product at the very end of its development. Through the entire process — from research and development to manufacturing and technical support – quality must be integrated into your culture.”
Fundamentals of trust checklist
Purchasing scientific reagents is an act of educated trust. Before purchase, consider how products you are considering align with our "fundamentals of trust" checklist.
|
 Fundamentals of trust checklist
For any questions surrounding NEB products, please contact our technical support.
Don’t miss out on our latest NEBinspired blog releases!
- Sign up to receive our e-newsletter
- Download your favorite feed reader and subscribe to our RSS feed
Be a part of NEBinspired! Submit your idea to have it featured in our blog.