Data Analysis - NEBNext Library Quant Kit (E7630)
4.1 Use the Real-time Thermal Cycler Software to Annotate the Concentration of the DNA Standards as Follows:
Table 4.1: Concentration of standards
| SAMPLE NAME | CONCENTRATION (pM) |
| DNA Standard 1 | 10 |
| DNA Standard 2 | 1 |
| DNA Standard 3 | 0.1 |
| DNA Standard 4 | 0.01 |
Once the appropriate wells are set as “Standard” confirm that the efficiency for the NEBNext Library Quant DNA Standards (derived from the slope of the linear fit of the DNA standard curve plotted on a log-scale x-axis) is 90–110%. The coefficient of determination (R2) for the linear fit of the standards should be ≥ 0.99.
4.2 Determine the Concentration of the Library Samples
- Obtain the concentration (in triplicate) of each diluted library sample from the qPCR thermal cycler using the standard curve generated by DNA standards 1–4. As a guide in table 4.2, obtain values for 1a-1c and 2a-2c.
- Calculate the average concentration of the 1:10,000 and 1:100,000 library dilution from the triplicates as indicated (1 and 2 in the table below).
Note: If the 1:10,000 dilution falls outside of the range of the standards, i.e. has a Cq value lower than that of DNA Standard 1, do not use that dilution to calculate concentration. Use only the 1:100,000 dilution. Similarly, if the Cq of the 1:100,000 dilution is greater than that of DNA Standard 4, use only the 1:10,000 dilution.
• Adjust each concentration for size, using the average size of the library normalized by the size of the standard fragment (399 bp).
• Calculate the concentration of the undiluted library stock by multiplying by the appropriate dilution factor (10,000 or 100,000).
| LIBRARY SAMPLE | CONC. (pM) FROM THERMAL CYCLER FOR EACH REPLICATE |
AVE. CONC. (pM) |
SIZE ADJUSTED CONC. (pM) |
CONC. OF UNDILUTED LIBRARY (pM) | ||
| Library Dilution 1 1:10,000 |
1a | 1b | 1c | 1 | 1 x 399/(Ave. library size) | 1adj x 10,000 |
| Library Dilution 2 1:1,000,000 |
2a | 2b | 2c | 2 | 2 x 399/(Ave. library size) | 2adj x 100,000 |
4.3 Recommendations
- If one of the triplicates of a diluted library sample (e.g. 1a, 1b, or 1c) is an outlier (> 0.5 Cq from the other replicates), then the data from this outlier should be excluded from the data analysis.
- For accurate quantitation, it is essential to have at least one library dilution that falls within the range of the DNA Standards 1–4. If all qPCR traces for the diluted library sample fall outside the range of the standards, then the qPCR assay should be repeated with greater (if faster than standard 1) or lower (if slower than standard 4) dilution.
- The traces for the NTC may show unexpected amplification due to contamination of library targets, primer-dimers, or amplified products if the qPCR assays have been performed repeatedly. As long as the Cq value for the NTC is far enough away from the dynamic range of the DNA Standards (e.g. Cq of NTC should be > 30), the NTC amplification can be ignored as it will not have any effect on library quantitation. If the NTC shows faster amplification, new NEBNext Library Quant Dilution Buffer should be prepared for the next runs.
4.4 NEBioCalculator
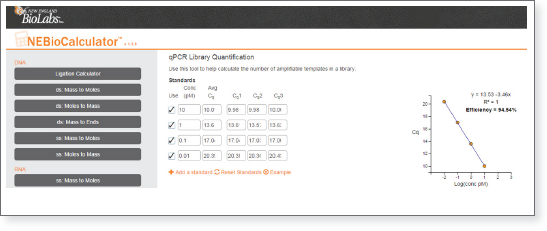
For efficient and convenient analysis of qPCR data from the NEBNext Library Quant Kit, we recommend using the NEBNext Library Quant qPCR tool available from the NEBioCalculator webtools menu. To use the tool, simply open a web browser to the webtool page and have available the Cq’s from the qPCR experiment.
- First enter the Cq values for the 4 standards into the standards boxes at the top of the page. The Cq average for each standard is then plotted against the known concentrations to calculate the PCR Efficiency and standard curve for library concentration determination. An example dataset is shown below:

- For each quantitated library, enter the size, dilution factor, and Cq for each well containing the library. Multiple dilutions for the same library are averaged together for highest quantitation accuracy. Size correction is calculated automatically.

- For each additional library, click the “Add a library” tab and enter the appropriate information and Cq data.

